Call Analytics & CDR Dashboards

CDR Dashboards allow for simple and efficient decision making — giving managers and administrators full visibility into communication performance.

Data-Driven Communications

Turn Call Data Into Business Insight

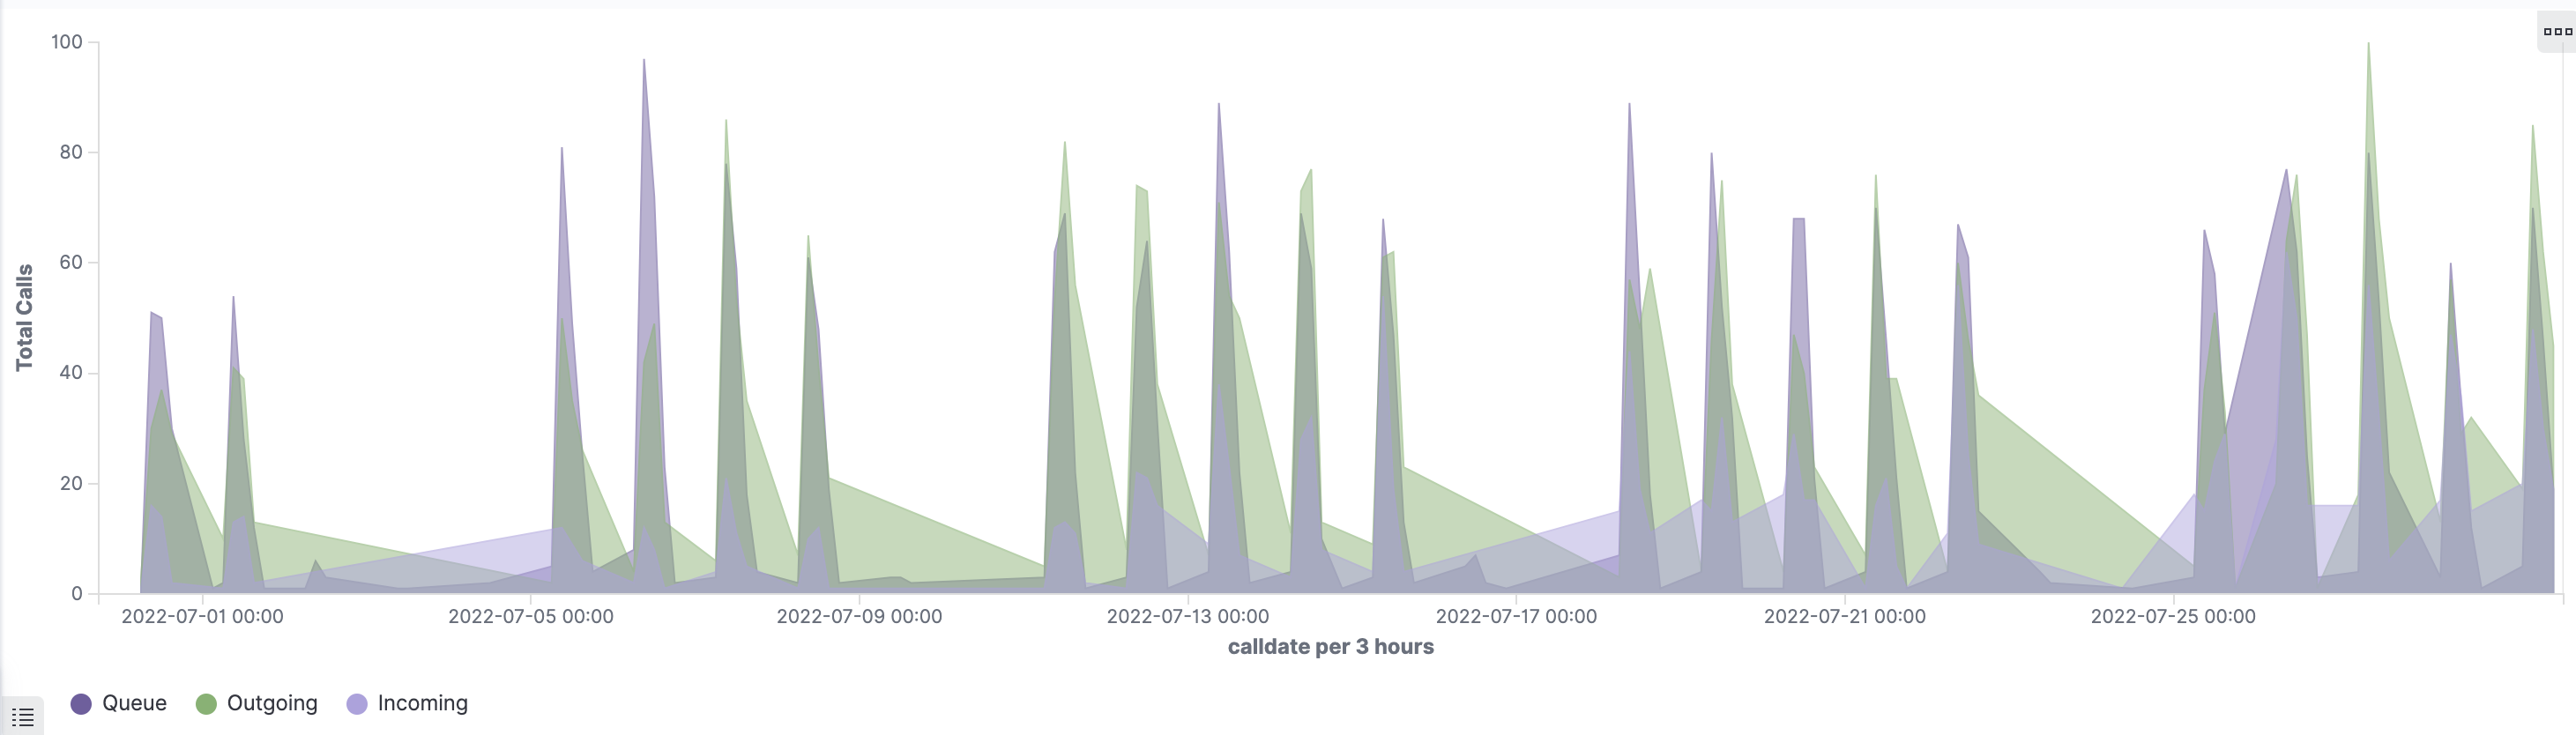
EBC's analytics platform, built on Kibana, transforms raw call detail records into actionable dashboards. Track volume, performance, and trends without needing a data analyst — the visualizations are built in.

  • Real-time and historical call data
  • Filter by department, queue, or call disposition
  • Track answered, unanswered, and abandoned calls
  • Visualize which channels customers use most
  • Monitor hold times, durations, and queue SLAs
EBC Analytics Overview
EBC CDR Dashboard — Channel Breakdown
Channel Analysis

Analyze Communication Channels

View a detailed breakdown of all communication channels — including queue activity, incoming vs. outgoing call percentages, and answered vs. unanswered ratios.

Understand exactly how your business communicates with customers so you can staff appropriately and identify high-volume windows.

  • Inbound vs. outbound breakdown
  • Queue vs. direct call analysis
  • Answered vs. unanswered ratios
EBC CDR Dashboard — Department Filter
Department Metrics

Filter Activities by Department

Drill down into performance metrics at the department or queue level. Sort and filter by average hold time, max hold time, queue call average duration, and max duration.

Know which teams are handling the most load — and where bottlenecks exist — before they impact the customer experience.

  • Average and max hold times per queue
  • Queue call average and max durations
  • Per-department filtering
EBC CDR Dashboard — Dispositions
Disposition Tracking

Sort Dispositions by Department

Track customer service metrics at a granular level. Filter by department and call outcome — answered, unanswered, abandoned — or any other disposition type.

  • Calls per month by team
  • Total hours on hold
  • Percentage of abandoned calls
  • Most-used channel by customers
EBC CDR Live Dashboard Screenshot
Traffic Optimization

Optimize Total Call Traffic

Visualize queue, outgoing, and incoming call volumes together in a unified CDR dashboard. Identify patterns, plan staffing, and optimize routing rules — all from one screen.

  • Combined queue + inbound + outbound view
  • Trend analysis over time
  • Exportable data for reporting
Key Metrics

Customer Service Metrics You Can Track

EBC analytics gives managers the data they need to make decisions — without waiting for a report.

Calls/mo

Call Volume

Track total calls per month — by team, queue, or individual agent.

Hold Time

Hold Performance

Average and max hold times surface where customers wait longest.

Abandon %

Abandoned Calls

Measure the percentage of callers who hung up before reaching an agent.

Channel Mix

Channel Usage

Understand which channels (voice, SMS, chat) customers prefer most.

Analytics Built Into Every Plan

CDR dashboards are included with EBC — not an add-on. Explore all the features that come standard.

View All Features